Riddler Tanks
Jun 7, 2019
Introduction
Based on actual statistics from World War II, this week's Riddler asks us to estimate the number of German tanks given uncertain information about the tanks we've observed. Fortunately, despite the uncertainty in our observations, we can still provide reasonably accurate estimates for the total German tank population. We'll rely heavily on Bayesian analysis to solve this problem. Let's continue with the full problem.
Mathematician Dr. Lana Gurtin has a problem to solve. She was hired by British intelligence for a top-secret assignment, but things have not gone according to plan. The year is 1942 and the Germans are rolling out a new and powerful tank, the Uberpanzer. Prominently displayed on the back of each Uberpanzer is its serial number, which is simply the number of tanks that had been built when it rolled off the line. So the first tank built has the serial number 1, the second one built has a 2, and so on.Recently, a number of these new tanks were spotted by British scouts who recorded the serial numbers that they saw. They immediately sent this information to British intelligence, hoping that the serial number data could be used to estimate the total number of Uberpanzers the Germans have built. This is when Dr. Gurtin was brought on to head the project.
But then the unexpected happened. A German spy intercepted the dossier with the data before it could reach MI6. By the time British agents caught up with the spy, most of the data had been destroyed. However, two pieces of information were recovered from the debris. One: The lowest serial number recorded was 22. Two: The highest serial number recorded was 114.
Luckily, Dr. Gurtin knows exactly what to do. Assuming that the original data set was a random sample of serial numbers, what is Dr. Gurtin’s best estimate of the total number of Uberpanzers the Germans have built?
The German Tank Problem
Because of this problem's fame, it is commonly referred to as the German Tank Problem. It also shares elements with capture-recapture problems. In both problems, we attempt to estimate a total population size, given some knowledge about samples from the population.
Problems like these are perfect for Bayesian techniques, because these techniques allow us to express uncertainty and confidence levels around the variable we are trying to measure. Specifically, a Bayesian analysis lets us calculate the probability distribution of population size. Before we solve this week's Riddler, let's review the Bayesian solution to the classic German Tank Problem.
Bayesian Solution
Suppose we have observed the following six serial numbers from a population of tanks of unknown size: 14, 36, 108, 65, 18, 97. Immediately we conclude the total population size must be at least as high as the largest number we've seen: 108. We've seen six numbers all with reasonably low values, so we might suspect the total population size is small, but we can't explicitly rule out the possibility that the total population is some larger number, like 500. However, we can determine the likelihood that the population size is 500, along with any other value we want to test.
In other words, we want to develop a formula for the probability that the total population is equal to some number, , given the information we have about the serial numbers we've observed. Interestingly, we don't care about most of the actual serial numbers we've observed, but rather the number of serial numbers we've observed. We'll call the total number of tanks we've seen . The only actual serial number we care about is the maximum value, which we'll call . Given these inputs, we have the following formula.
Plugging in our values, we have and . Suppose we want to know the probability that total population is . We solve . We could also test , where we calculate . Very small, but still possible. The key takeaway is that we can't solve the problem with certainty, but we can develop an understanding of the ranges of values we might expect.
Riddler Solution
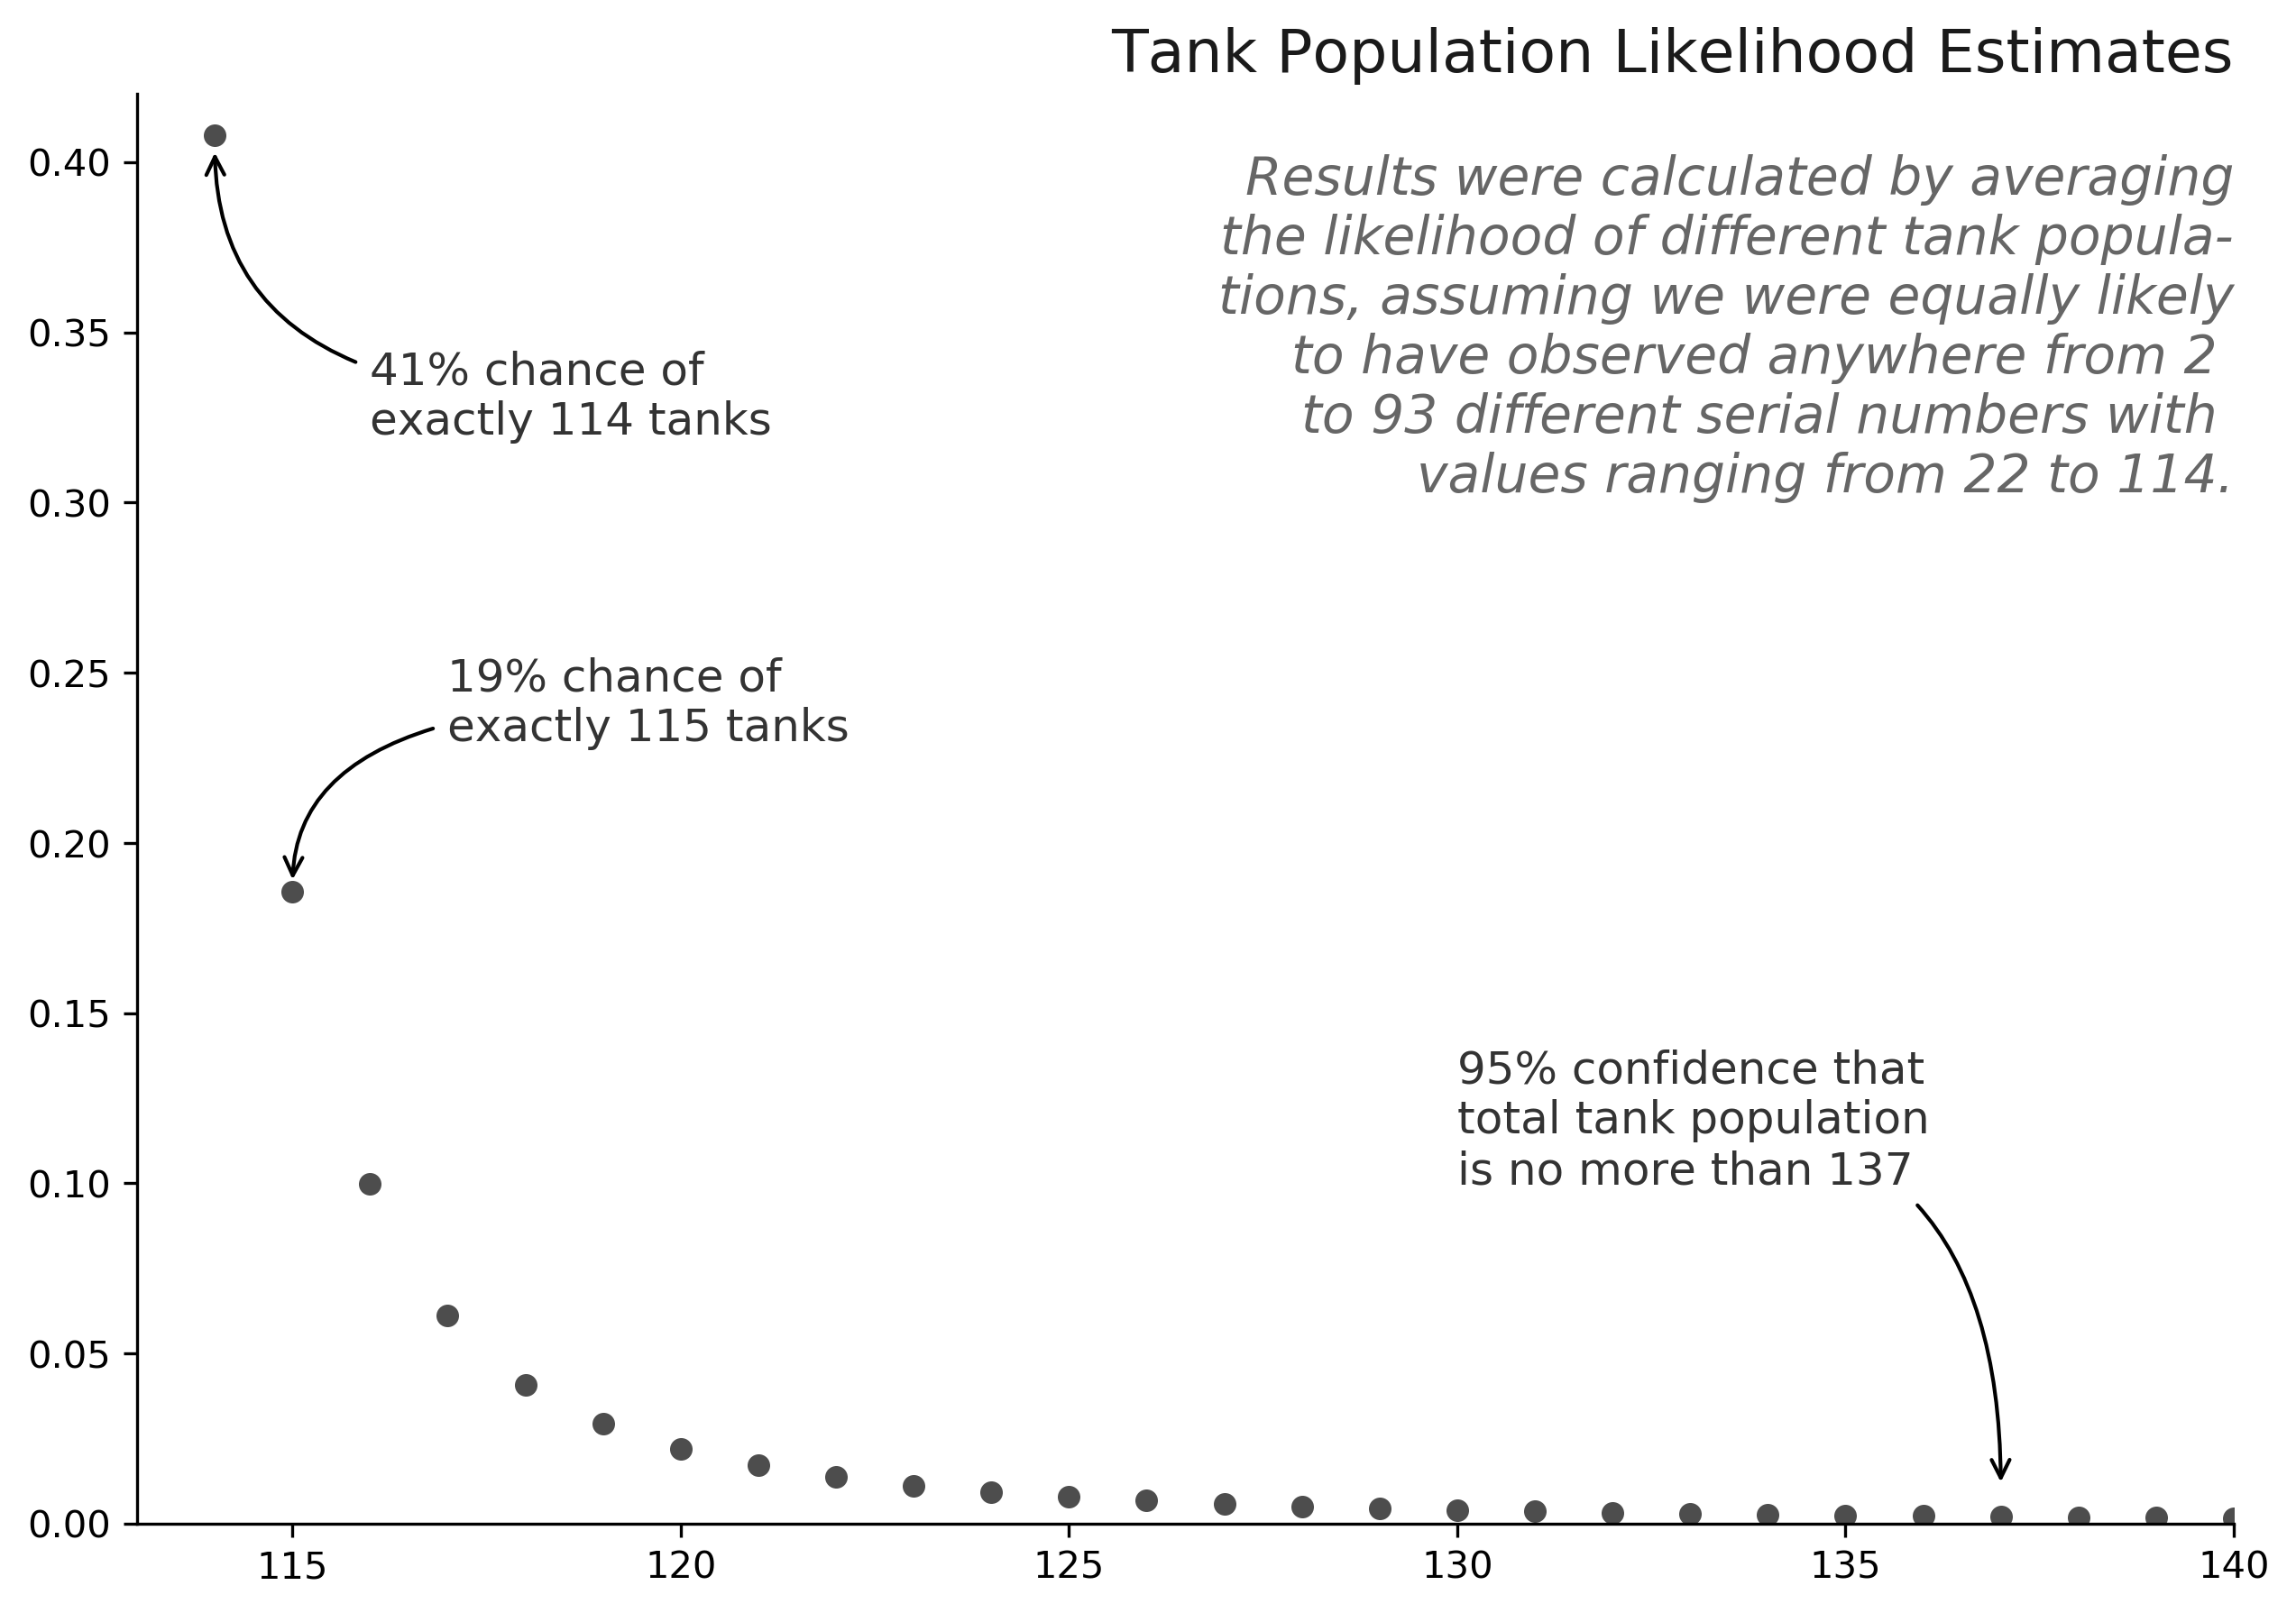
This week's Riddler has several similarities with the German Tank Problem, except that we can't be certain what our value of is. We know for a fact that we observed at least 2 serial numbers, 22 and 114. And, critically, we know our value of should be 114 - the highest value we've seen. But we could have observed many more serial numbers, perhaps as many as 93 in total, if we had somehow seen every single number between 22 and 114. According to the problem text, the original data set was a random sample of serial numbers, which I'll interpret to mean our value of should be uniformly distributed between 2 and 93, meaning each value was equally likely.
Before, we had a one-dimensional problem where we solved for many values of . Now, we have a two-dimensional problem, where we want to solve for many values of across many values of . Because the values of are uniformly distributed, we should average our values with respect to in order to solve for the values of .
For example, if , then the likelihood that is , because having seen just two serial numbers, we can't conclude much about the true population size. However, if , then the likelihood that is , because we've seen over 90 tanks with no value higher than 114. When we average across all from 2 to 93, we find the probability that total tank population is 114 is roughly . Of course, we need to consider all other values of as well, which we do in the following chart. We see that the single best estimate for total population size is 114, and while we can't be certain of the exact tank population, we can be 95% sure that the total German tank population is less than 138.
Therefore, despite the best efforts of the courageous German spy, it seems that probability theory is still enough to give the Allies an advantage.
Full Code
The code this week is quite simple, leveraging the Bayesian formula for population estimates. The only tricky part is to test across multiple values of and , then average the results for the correct answer. As always, please let me know if you have any questions or comments!
import numpy as np
from scipy.special import comb

def model(n, k=2, m=114):
    """
    Calculates the probability that "n" total tanks exist, given that we
    have observed "k" tanks and have seen a highest serial number, "m".

    Parameters
    ----------
    n : int, the number of tanks we posit as existing.
        n >= m
    k : int, the number of tanks whose serial numbers we have observed
        1 < k <= m
    m : int, the highest serial number we observed from the "k" tanks

    Returns
    -------
    P(N=n) : float, the probability of "n" tanks existing
    """
    return (k-1)/k * comb(m-1, k-1) / comb(n, k)


if __name__ == '__main__':

    # create arrays to represent possible values of n and k
    n = np.arange(114, 501)
    k = np.arange(2, 94).reshape(-1, 1)

    # calculate probabilities under each pair of variables
    results = model(n=n, k=k, m=114)

    # reduce dimension by averaging across all values of k
    results = results.mean(0)

    # print results
    for n, p in zip(n, results):
        if n < 150: print(f'P(N={n}) = {p:.2%}')