Riddler Hot Potato
Aug 4, 2017
By far my favorite puzzles are those that can be solved through simulation. I'll be the first to admit that I default to that approach even when the problem doesn't require a programmatic solution. This puzzle, from fivethirtyeight riddler is a perfect example. It can be solved analytically by identifying the puzzle's symmetry, and indeed a featured solver did just that. However, I found it incredibly fun to explore different visualizations of this puzzle and to optimize my simulation algorithm to run more trials faster and faster.
A class of 30 children is playing a game where they all stand in a circle along with their teacher. The teacher is holding two things: a coin and a potato. The game progresses like this: The teacher tosses the coin. Whoever holds the potato passes it to the left if the coin comes up heads and to the right if the coin comes up tails. The game ends when every child except one has held the potato, and the one who hasn’t is declared the winner.How do a child’s chances of winning change depending on where they are in the circle? In other words, what is each child’s win probability?
For completeness, I'll briefly describe the analytical solution, which is quite elegant. A student wins the game if the person to her left and the person to her right hold the potato. In order for that to happen without our example student holding the potato herself, the potato must must traverse the entire circle - either from right to left or left to right. Each student's perspective is identical, regardless of the position the student occupies (even if the student starts right next to the teacher). Therefore, because each student has a symmetrical win condition, the probability of winning must be equal among them. With 30 students, that means the probability is each.
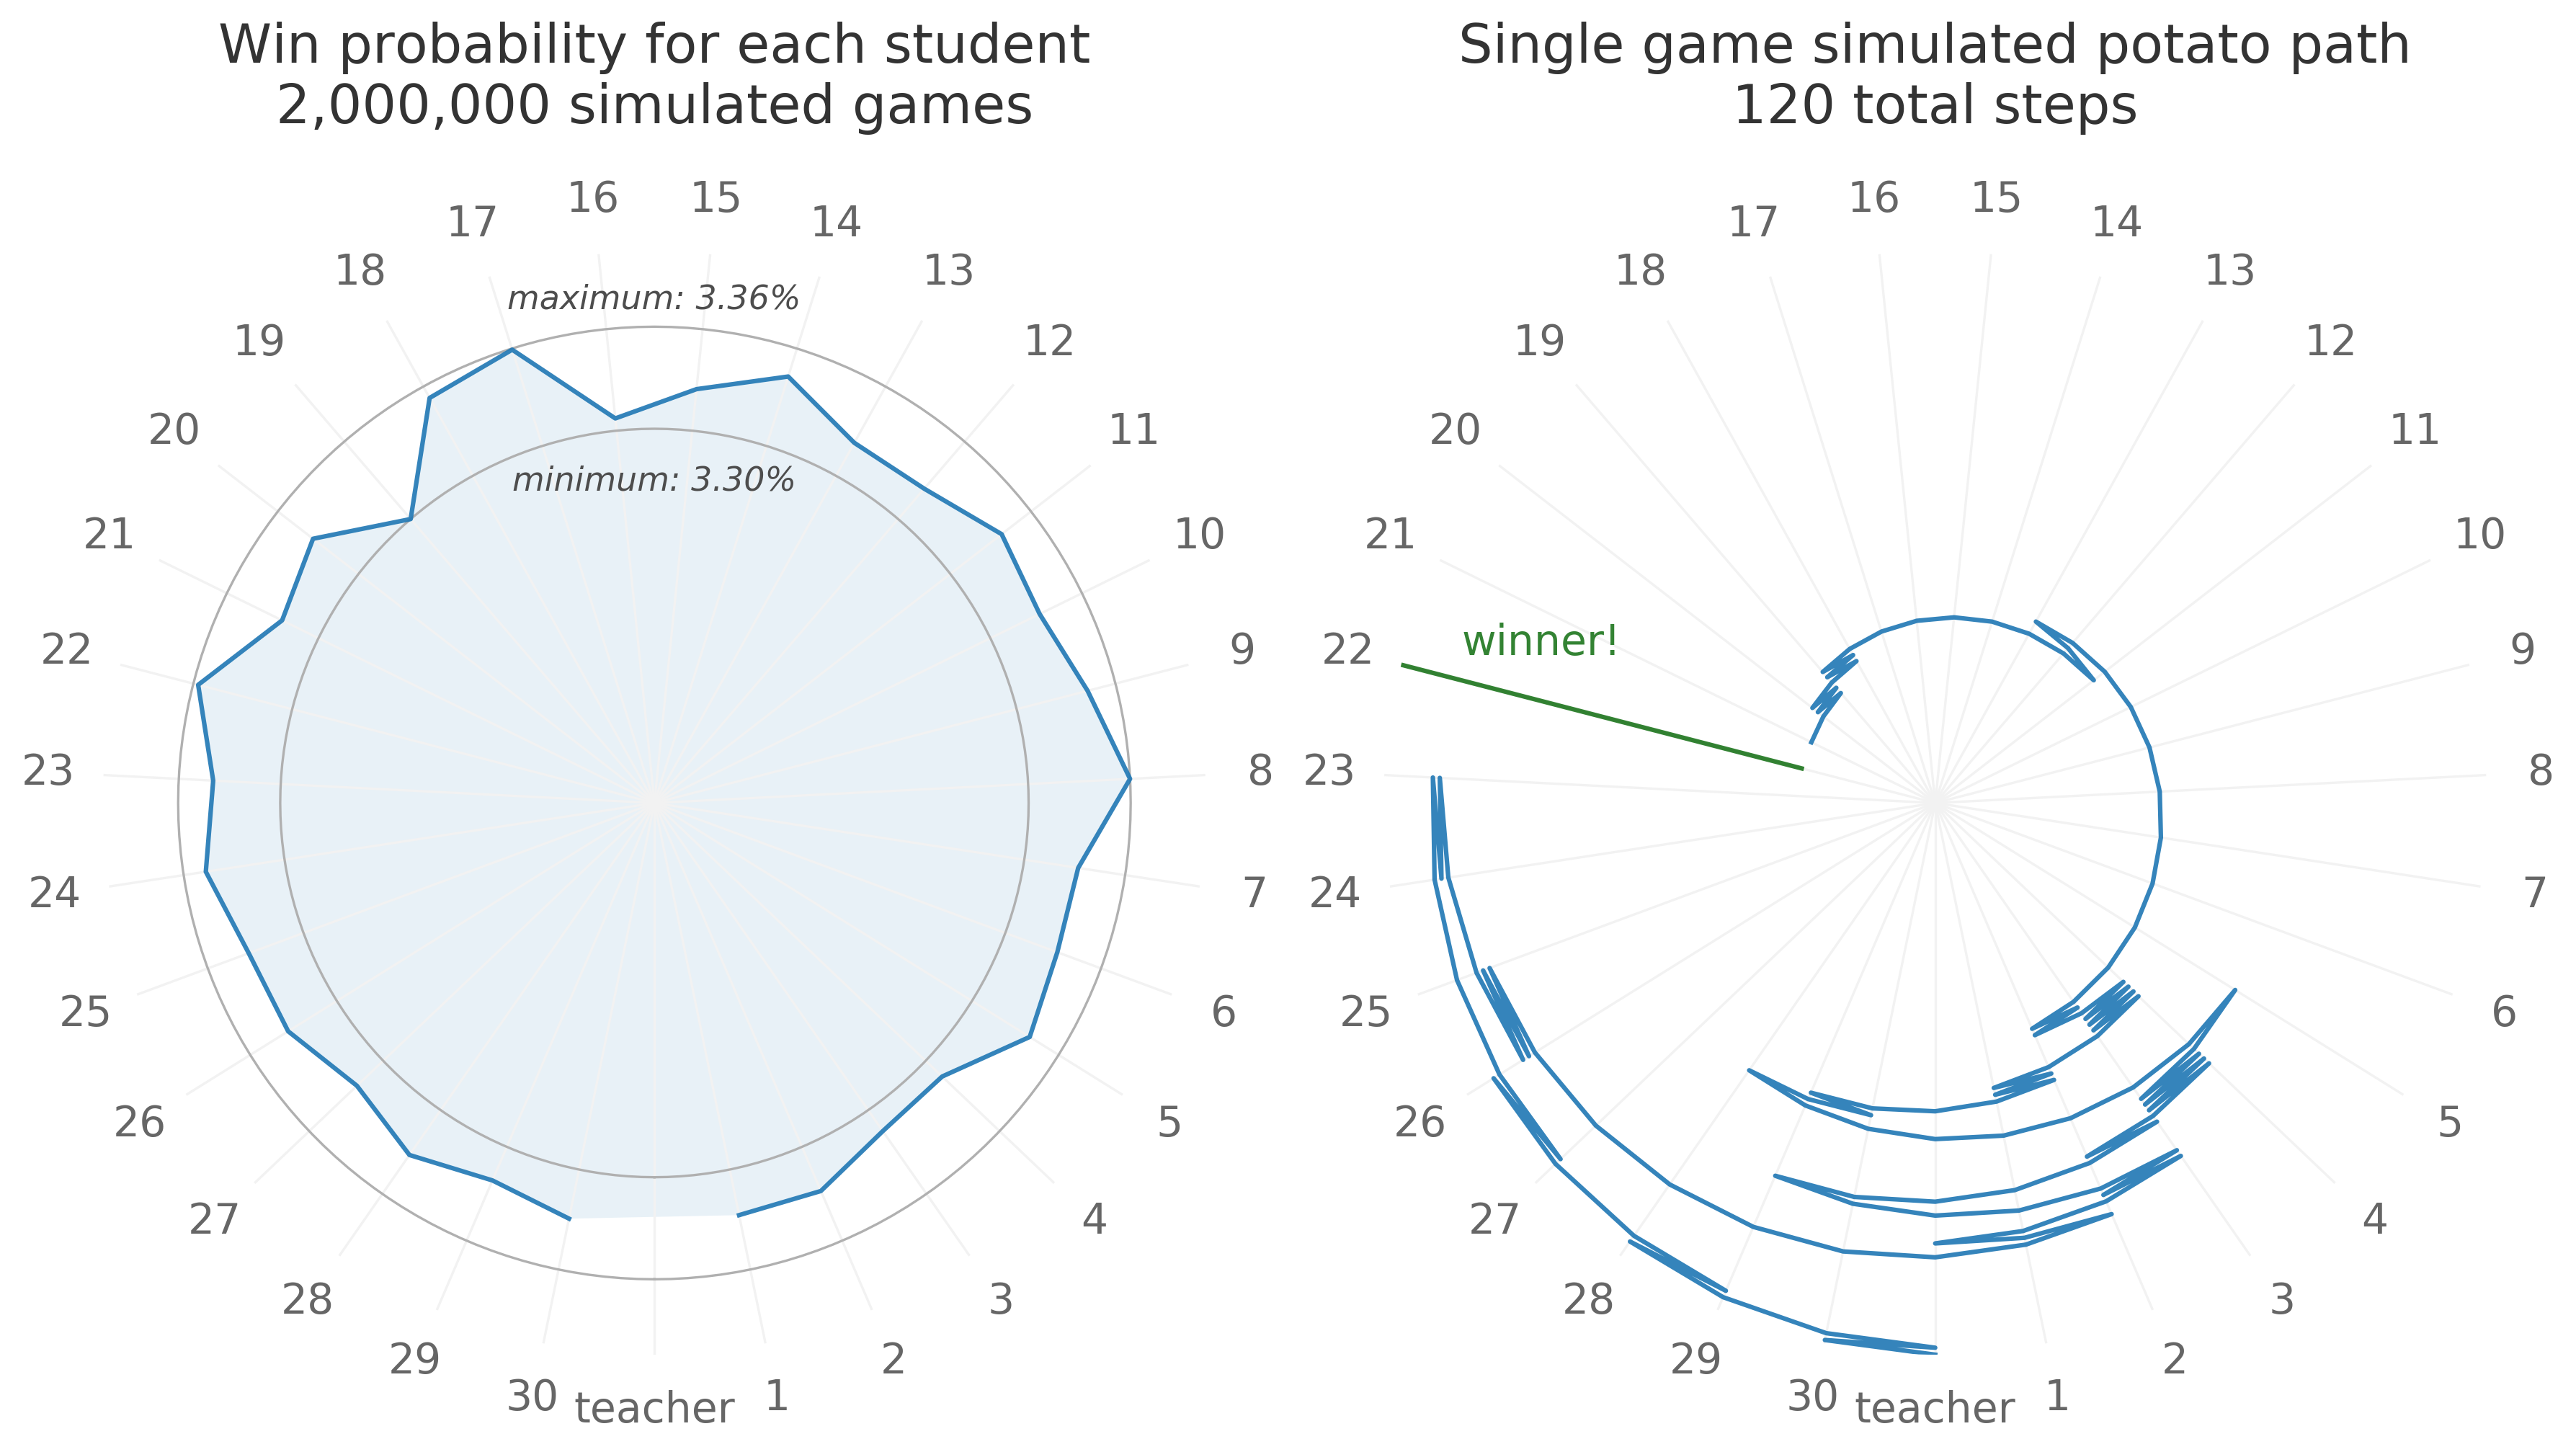
Of course, my first step in tackling this problem was to write a program in Python! I started with an array of length 31. The teacher was in position 0, and the students were in positions 1-30. Each student started with a value of 1, which indicates that they are still eligible to win the game. The teacher started with a value of 0 because she can't win by definition. At each step, the potato moves around the circle, and if it reaches a given student, that student's counter is set to zero. The game continues until only a single student has a value of 1, and that student is declared the winner.
Originally I used a numpy array and identified the winning student by calling array.argmax() to find the solitary 1, but I realized the program ran about twice as fast if I used a native python list and found the winning student by calling list.index(1). I eventually ran two million scenarios and it took about 15 minutes. My simulations confirmed the analytical result, with each student winning the game at a rate between 0.0330 and 0.0336.
In addition to optimizing the speed of my simulation, I really enjoyed testing different ways of visualizing the results. I started with a simple cartesian plane with x values from 1-30, with the goal being to show a roughly flat line around . But a far corner of my brain suggested trying a radial plot instead - after all, the students are sitting in a circle! It made perfect sense to visualize probabilities exactly the way the game was designed. This was my first stab at radial plots using matplotlib, and after many iterations, I arrived at a design that I felt balanced the small variations caused by simulation with the overall message that the probabilities were more or less equal.
Finally, I wondered how I might illustrate a single game, showing the potato swinging randomly back and forth across the circle. With a little matplotlib hackery I traced the path of the potato from the edge of the plot moving inward. I think this part of the visualization made the entire thing come together nicely.
Luckily - or perhaps due to a bit of self-promotion - my work paid off and my visualization was featured in the solution the next week!
import random
import numpy as np
import matplotlib.pyplot as plt

def model(trials, students=30):
    """
    Generator function that returns the position of the
    winning student in the hot potato game

    The teacher is in position 0, and cannot win the game
    by definition. The student to the teacher's right is
    in position 1. The student to the teacher's left is in
    position 30. Each round, the potato is passed to the
    right (+1), or to the left (-1). The game ends when
    a single student has never held the potato.

    Parameters
    ----------
    trials : int, the number of scenarios to generate
    student : int, the number of students, default 30

    Yields
    ------
    s : int, the position of the winning student
    """
    for _ in range(trials):

        s, i = [0] + [1]*students, 0

        while sum(s) > 1:
            i += random.choice([-1,1])
            s[i] = 0

        yield s.index(1)

def sample_path(students=30):
    """
    Generate the sample path of the potato during a single game

    Parameters
    ----------
    students : int, the number of students, default 30

    Yields
    ------
    s : int, the student with the potato at each step
    """
    # same example every time
    np.random.seed(42)

    s, i = [0] + [1]*students, 0

    while sum(s) > 1:
        i += np.random.choice([-1,1])
        s[i] = 0

        yield i

# calculate the winning position over a given number of trials
trials = 2000000
results = np.array(list(model(trials)))
p = np.histogram(results,bins=range(1,32),normed=True)[0]

# generate a sample path for a single game
path = np.insert(np.array(list(sample_path())),0,0)

# plot the results
fig, ax = plt.subplots(1,2,figsize=(12,6),subplot_kw=dict(projection='polar'))
plt.tight_layout()
kwargs = dict(y=1.1,color='0.2',size=18)
ax[0].set_title(
    'Win probability for each student\n'
    '{:,.0f} simulated games'.format(trials),**kwargs
)
ax[1].set_title(
    'Single game simulated potato path\n'
    '{:,.0f} total steps'.format(path.shape[0]),**kwargs
)

# plot data
points = np.deg2rad(np.linspace(0,360,31,endpoint=False))

ax[0].plot(points[1:],p,alpha=0.9)
ax[0].fill_between(points[1:],p,0,alpha=0.1)

ax[1].plot(points[path],np.linspace(1,0.25,path.shape[0]),alpha=0.9)
ax[1].axvline(points[22],0.25,1,color='darkgreen',alpha=0.8)

# domain and range
ax[0].set_ylim(0.031,0.034)
ax[0].set_yticks([round(p.min(),6),round(p.max(),6)])
ax[0].set_yticklabels([])

ax[1].set_ylim(0,1)
ax[1].set_yticks([])

# annotations
kwargs = dict(ha='center',color='0.3',style='italic',size=11)
ax[0].annotate('minimum: {:,.2%}'.format(p.min()),xy=(np.pi,p.min()*0.99),**kwargs)
ax[0].annotate('maximum: {:,.2%}'.format(p.max()),xy=(np.pi,p.max()*1.003),**kwargs)

ax[1].annotate('winner!',xy=(points[22]-0.05,0.9),color='darkgreen',size=14,alpha=0.8)

# style, circumference labels, 'teacher' label at the bottom
for i in range(2):
    ax[i].spines['polar'].set_visible(False)
    ax[i].xaxis.grid(True,color='0.95')
    ax[i].set_xticks(points)
    ax[i].set_xticklabels(['teacher'] + list(range(1,31)),size=14,color='0.4')
    ax[i].set_theta_offset(-np.pi/2)

plt.show()